filebeat 설치과정
filebeat 플러그인을 동작테스트 하기위한 log file 샘플
sample data : https://download.elastic.co/demos/logstash/gettingstarted/logstash-tutorial.log.gz
https://www.elastic.co/kr/downloads/beats/filebeat (사용하는 OS에 맞게 다운로드)
filebeat 는 주기적으로 생성된 access,error,debug,행동패턴,관리되어야하는 파일등을
수집하기위한 agent 클라이언트 정도라고 생각하시면됩니다.
Logstash 설정
conf.d 폴더 하위에 filebeatsToRedis.conf 생성
input {
  beats {
    port => "5044"
  }
}

output {
  elasticsearch {
    hosts => "localhost:9200"
    manage_template => false
    index => "%{[@metadata][beat]}-%{[@metadata][version]}-%{+YYYY.MM.dd}"
  }
  stdout {
    codec => rubydebug
  }
}
Input 으로는 filebeats 에 설정된 filebeats.yml 에 Log 파일을 읽어들일 예정입니다.
Output 으로는 Elasticsearch에 index를 생성하도록 하겠습니다. 생성되는 index 파일명은 소스레벨에 명시한것처럼
beat-version-yyyy-MM-dd 형태입니다.
Filebeats 설정
filebeat.yml
#=========================== Filebeat inputs =============================

filebeat.inputs:

# Each - is an input. Most options can be set at the input level, so
# you can use different inputs for various configurations.
# Below are the input specific configurations.

- type: log

  # Change to true to enable this input configuration.
  enabled: true

  # Paths that should be crawled and fetched. Glob based paths.
  paths:
    #- /var/log/*.log
    - /Users/renzo/espack/demo/filelog/logstash-*.log
    #- c:\programdata\elasticsearch\logs\*


#================================ Outputs =====================================

# Configure what output to use when sending the data collected by the beat.

#-------------------------- Elasticsearch output ------------------------------
#output.elasticsearch:
  # Array of hosts to connect to.
  #hosts: ["localhost:9200"]

  # Optional protocol and basic auth credentials.
  #protocol: "https"
  #username: "elastic"
  #password: "changeme"

#----------------------------- Logstash output --------------------------------
output.logstash:
  # The Logstash hosts
  hosts: ["localhost:5044"]

  # Optional SSL. By default is off.
  # List of root certificates for HTTPS server verifications
  #ssl.certificate_authorities: ["/etc/pki/root/ca.pem"]

  # Certificate for SSL client authentication
  #ssl.certificate: "/etc/pki/client/cert.pem"

  # Client Certificate Key
  #ssl.key: "/etc/pki/client/cert.key"
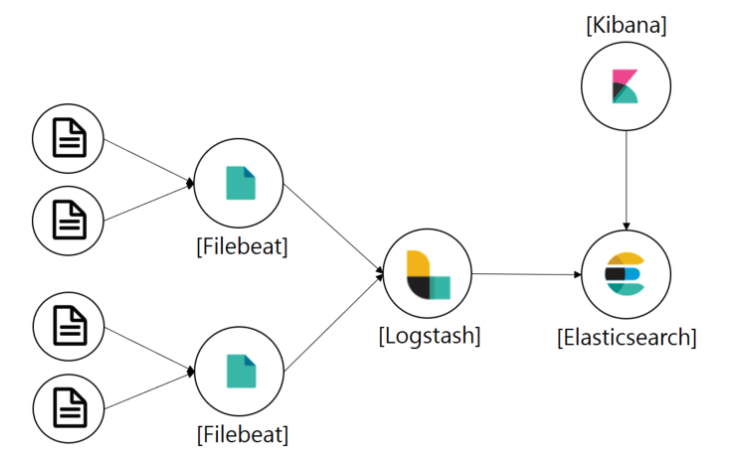
기본으로 filebeat도 Input, Output 구성을 한뒤에 사용가능합니다.
Logstash 와 함께 연동해서 진행해도되고 별도 커스텀하거나 별다은 프로세스 플러그인들이 필요없다면
filebeat 만으로도 원하는 로그 적재가 가능합니다.
yml 까지 설정이 되었다면
Elasticsearch
Kibana
Logstash
서비스 구동후 filebeat 를 실행하시면됩니다.
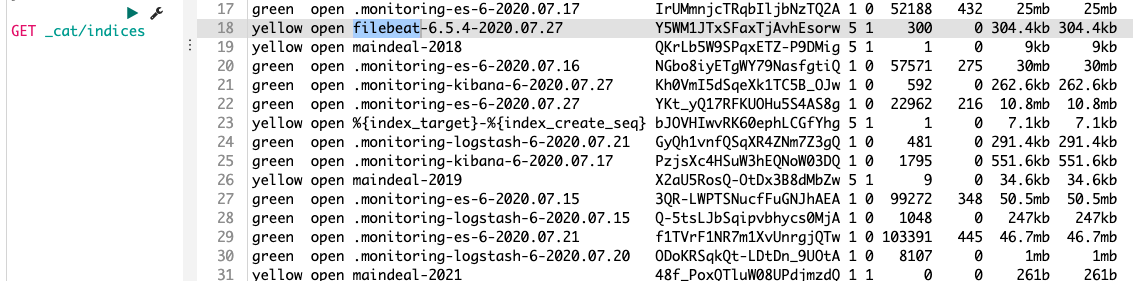
./filebeat -e정상적으로 서비스가 동작한다면 Elasticsearch 에 filebeat index가 생성되는것을 확인할수 있는데요
아래처럼 "GET _cat/indices "명령어로 index 확인하시면됩니다.